You can feel it in the air — that perfect mix of crisp breeze and buzz that only college football Saturdays bring. The kind of morning where the coffee hits different and every tailgate smells amazing.
What a fantastic day for football. That fall weather is starting to turn the corner. Fall is the best season. Football, pumpkin spice, and OU vs Texas!
The Matador is listed probable…..

Texas Offense vs Oklahoma Defense
Texas Offense
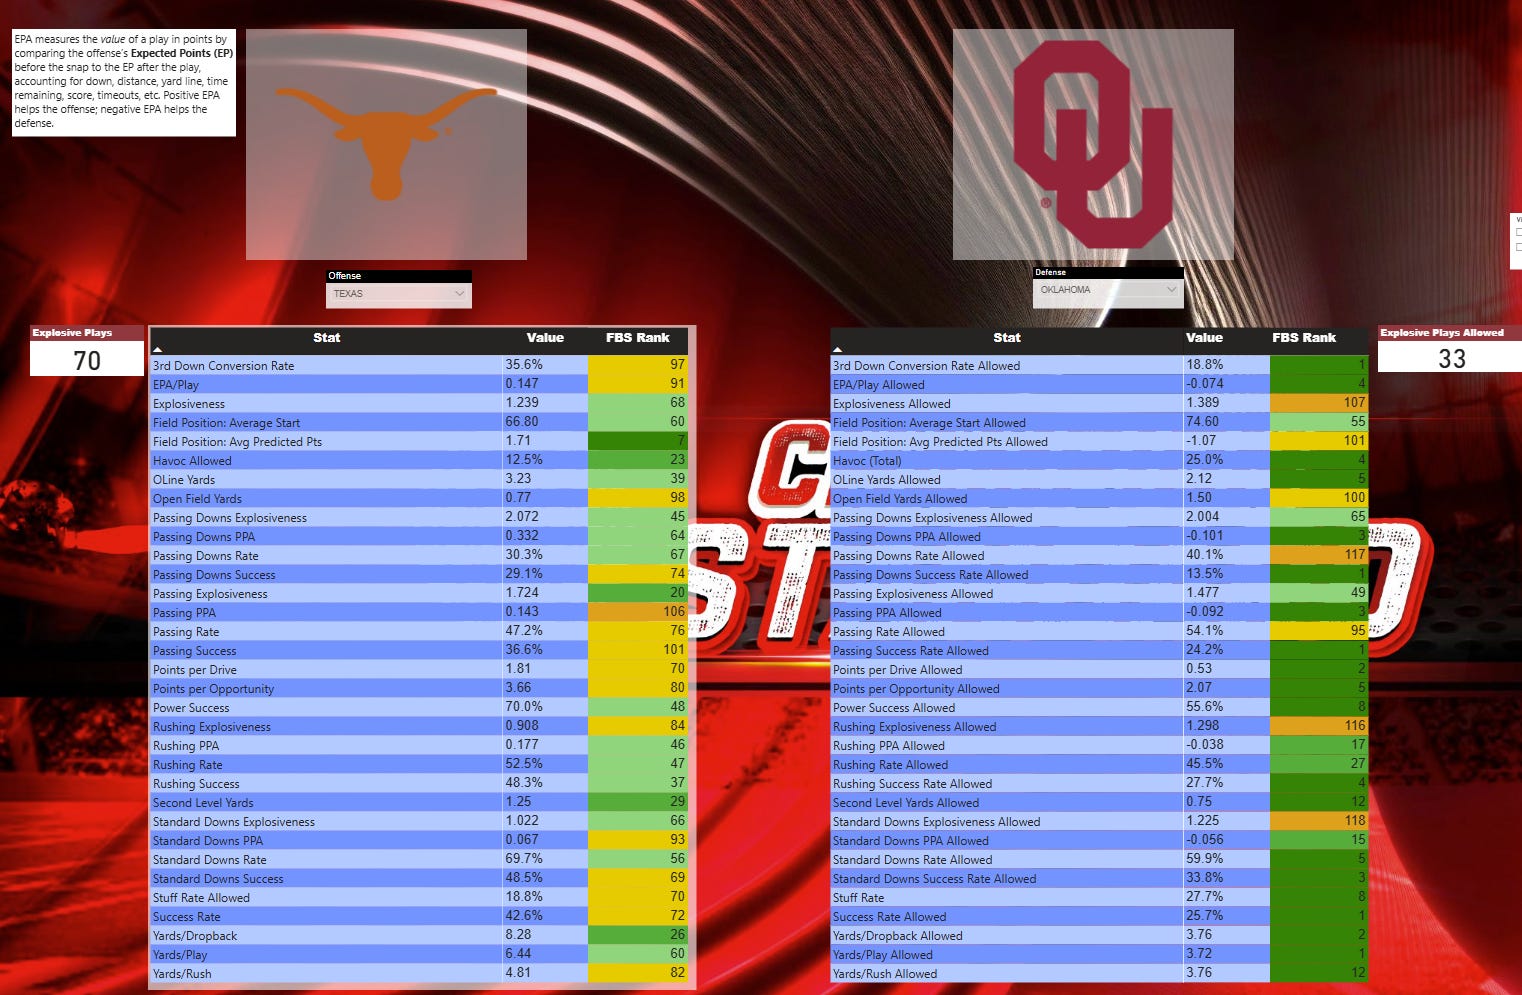
Texas’ offensive numbers paint the picture of a unit that can flash explosiveness but lacks sustained success.
EPA/Play: 0.147 (No. 91 FBS)
3rd Down Conversion Rate: 35.6% (No. 97)
Passing Success Rate: 36.6% (No. 106)
Rushing Success Rate: 52.5% (No. 37)
Explosive Plays: 70 total
That last number — 70 explosive plays — shows there’s still danger here. The Longhorns can hit chunk gains, especially in play-action or broken plays, but their inefficiency on early downs (below-average Standard Downs Success and 29% Passing Downs Success) often forces them into long third downs they can’t convert.
Their offensive line has been a major culprit. Despite averaging 4.81 yards per rush (No. 82 nationally), Texas ranks poorly in Line Yards (3.23, No. 70) and Power Success (76%, No. 44) — meaning they struggle to get consistent push in short-yardage situations. The run game often stalls before it starts, leading to predictable passing downs where protection issues are exposed.
Quarterback Arch Manning has shown flashes of arm talent but remains under duress far too often. With limited pre-snap awareness and protection breakdowns, Texas has been forced into inefficient, high-pressure passing scenarios.
Oklahoma Defense
Brent Venables’ defense has evolved into one of the most suffocating units in college football. It’s not just about pressure — it’s about precision. The Sooners’ defensive metrics are elite across the board:
3rd Down Conversion Rate Allowed: 18.8% (No. 1 FBS) (Penalties Excluded)
EPA/Play Allowed: -0.074 (No. 4)
Points per Drive Allowed: 1.17 (No. 4)
Stuff Rate: 27.7% (No. 4)
Yards/Dropback Allowed: 3.76 (No. 1)
33 Explosives Allowed (note at bottom)
Yards/Rush Allowed: 3.76 (No. 12)
Simply put, this defense closes windows faster than any offense can open them. The combination of David Stone, Damonic Williams and Jayden Jackson inside has shut down the middle, while R. Mason Thomas has wrecked passing downs from the edge spot.
The Sooners rank No. 1 in Havoc Rate (25.0%), a metric that measures disruptive plays (sacks, Stops, TFLs, PBUs, and forced fumbles). That means one in every four snaps results in a negative play for the opponent — an absurd rate that highlights both their speed and anticipation.
The one small vulnerability lies in rushing explosiveness allowed (No. 116) — a byproduct of their attacking style. If Texas has a chance, it’s by hitting a big play early off misdirection or catching OU over-pursuing on a counter or jet sweep.
The Bottom Line
This matchup is strength vs. weakness. Oklahoma’s defense thrives on execution, communication, and physicality — all things Texas’ offense has struggled to maintain.
Unless the Longhorns can hit a couple of home-run plays early, their offense is in for a long afternoon. The Sooners’ defensive front is built to suffocate run lanes and collapse pockets, and Venables’ unit has shown no signs of giving up methodical drives.
Prediction:
Texas Explosive Plays: 2–3 max
Oklahoma Sacks: 12+ (Yeah, NCAA Record is 15.)
EPA/Play Differential: OU by +0.20
Edge: Oklahoma Defense — decisively.
Oklahoma Offense vs. Texas Defense
This matchup is a true heavyweight chess match — the most complete version of Ben Arbuckle system meeting one of the most balanced defensive units in college football.
Oklahoma’s offense enters as one of the most efficient and explosive in the nation. They rank top-30 nationally in EPA/play (0.258), 3rd down conversion rate (48.4%), and Passing Success (50.3%), while generating 77 explosive plays through the season.
Texas, on the other hand, doesn’t rely on chaos — they control it. The Longhorn defense is disciplined, physical, and stingy, ranking top-25 in nearly every defensive category, including EPA/play allowed (0.09), Success Rate allowed (43.9%), and Yards per Dropback allowed (5.46).
This game is going to hinge on OU’s tempo, balance, and their ability to protect their quarterback against Texas’ controlled front.
OU Offense: Balance, Tempo, and Efficiency
Under Ben Arbuckle, Oklahoma’s offense thrives on pace, formation disrupters, pre-snap movement, and forcing defenses to defend every blade of grass.
Key Stats (OU Offense):
EPA/Play: 0.258 (No. 29 FBS)
3rd Down Conversion Rate: 48.4% (No. 31)
Points per Opportunity: 4.50 (No. 42)
Passing Success Rate: 50.3% (No. 31)
Rushing Success Rate: 52.0% (No. 42)
Explosive Plays: 77 (elite)
OU’s offensive line has held up well in protection (Havoc Allowed: 16.3%, No. 45), but the rushing attack has been flat-out bad. The Sooners rank just 83rd in Line Yards (2.76) and have struggled to generate consistent push or movement in short-yardage situations. The run game lacks identity and explosiveness, often forcing the offense to rely on the passing game to stay ahead of the chains and keep the tempo alive.
OU ranks top-15 nationally in Standard Downs Success (49.0%), meaning they are efficient early in drives — a major contrast to Texas’ bend-but-don’t-break style.
The vertical passing game remains the spark. The Sooners’ Passing Explosiveness (1.441) and Passing Downs EPA (0.481) show how often they capitalize on breakdowns once defenses start cheating against the run.
Texas Defense: Strength in Structure
Pete Kwiatkowski’s Texas defense doesn’t blitz often — because they don’t have to. The front seven controls gaps with power and length, while the secondary sits in pattern-match coverages that minimize space after the catch.
Key Stats (Texas Defense):
EPA/Play Allowed: 0.090 (No. 13 FBS)
3rd Down Conversion Rate Allowed: 33.3% (No. 22)
Rushing Success Rate Allowed: 49.2% (No. 68)
Passing Success Rate Allowed: 33.1% (No. 3)
Yards/Dropback Allowed: 5.46 (No. 14)
Yards/Rush Allowed: 3.48 (No. 5)
41 Explosives Allowed
Texas post elite run-fit numbers — top-10 in Yards/Rush allowed and Power Success (No. 7) — while rarely needing extra help in the box.
On the back end, Texas is one of the nation’s best at defending standard-down play-action. Their Passing Downs Success Rate Allowed (31.1%, No. 41) and Passing Explosiveness Allowed (1.415, No. 30) suggest they can limit the big shots that OU feasts on.
If there’s one area to test them, it’s tempo and motion. Texas is built to suffocate static, downhill teams — not necessarily to chase pace and quick reads.
The Bottom Line
OU wants rhythm, Texas wants friction. The Sooners need pace and spacing to create clean windows; the Longhorns want to squeeze every inch of the field and make OU execute 10–12 plays per drive.
Both units are solid units in their own right — OU’s offense ranked Top-20 in efficiency, Texas’ defense Top-15 in resistance.
If OU’s tempo forces fatigue and miscommunication, the Sooners can rack up chunk plays and points. If Texas keeps them off schedule and controls the line of scrimmage, it becomes a low-scoring slugfest.
Prediction:
OU Explosive Plays: 8+
EPA/Play Differential: OU +0.12
Texas Sack Total: 3 or fewer
Edge: Slight lean — Oklahoma Offense
Thank you for reading!
Hope to see you at the next tailgate party!
BOOMER!
TEXSA SUXXX
Oklahoma 31 - Texsa 13!

SOURCE DATA NOTE:
This is my first year tracking play-by-play data directly from ESPN’s public access feed — and while it’s essentially free and open-source, it’s the same foundation every advanced stats model builds from. Some social media analytics accounts are plugged into proprietary or blended data sources, which can make their numbers look slightly different. At first, I was worried my stats were off — but after auditing the data, I realized they actually check out.
Here’s what I found:
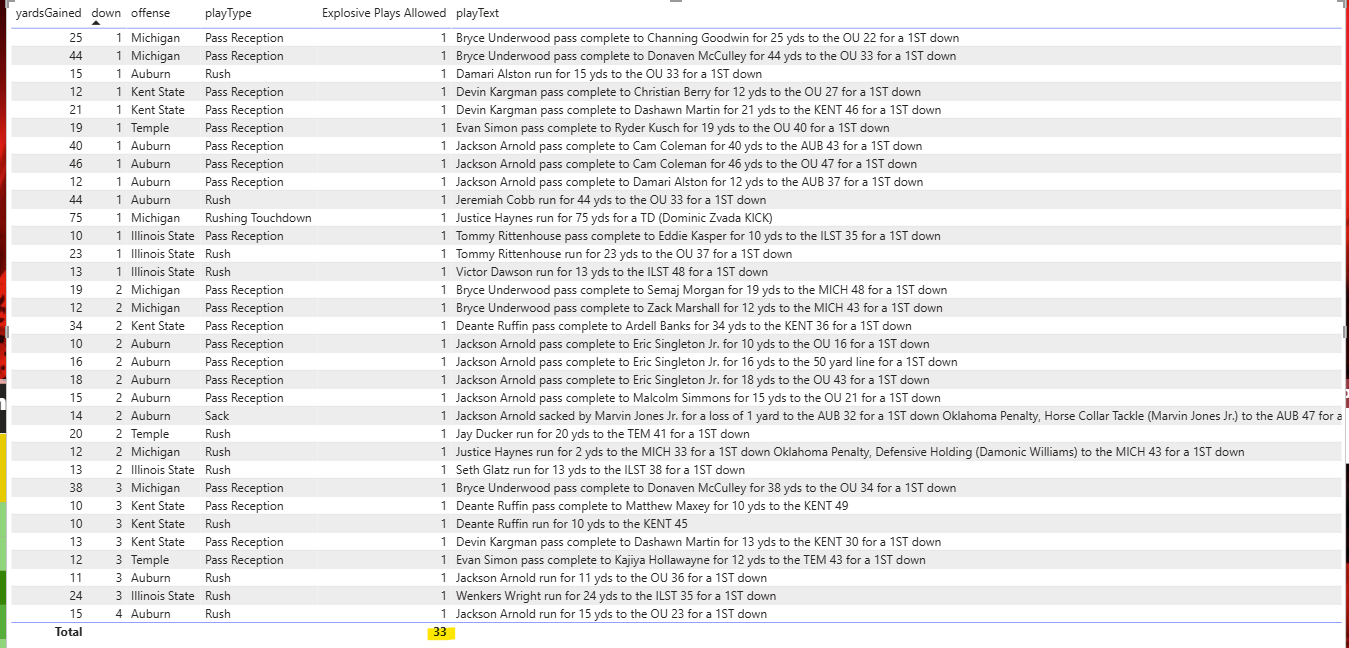
Oklahoma’s defense has allowed 33 explosive plays through the season. Of those, 14 have come on 1st down for 400 total yards, and 11 have come on 2nd down for another 183 yards. That’s 25 of their 33 explosives — roughly 75% — happening on Standard Downs.
That one split alone explains why OU ranks 118th nationally in Standard Downs Explosiveness Allowed and 116th in Rushing Explosiveness Allowed.
For example, Justice Haynes’ 75-yard touchdown run vs. Michigan came on 1st down. Plays like that have an outsized impact on the metrics. Explosiveness is an average EPA or yards gained per successful play, not a rate. So a few home runs can completely tank the national rank — even if OU gives up far fewer explosive plays overall.
The calculations are right based on the data I’m tapped into.